European Commission – Road safety statistics 2014
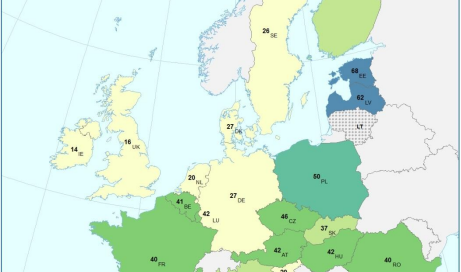
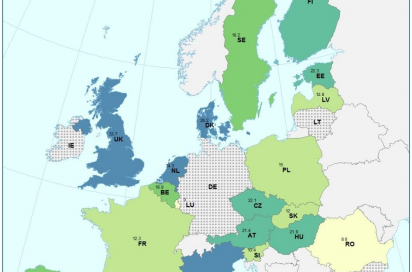
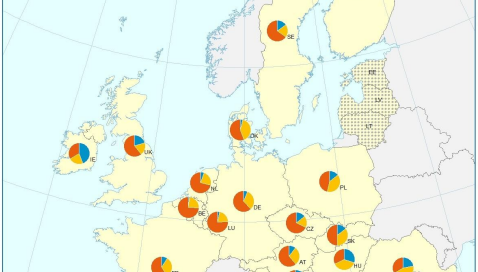
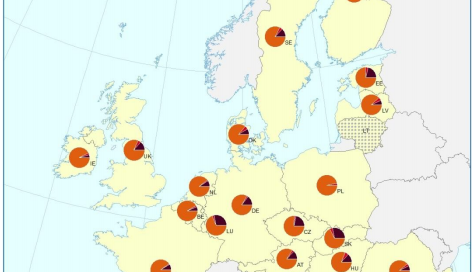
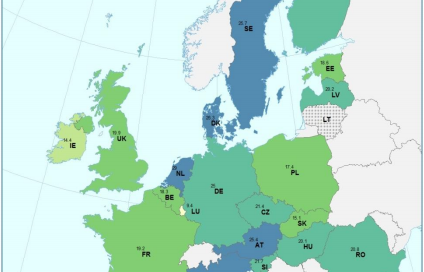
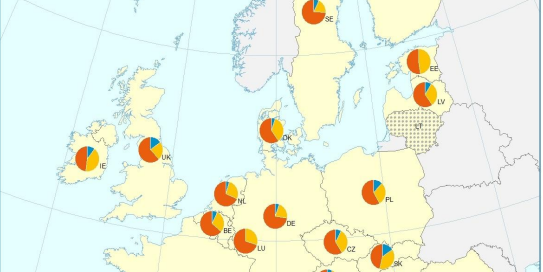
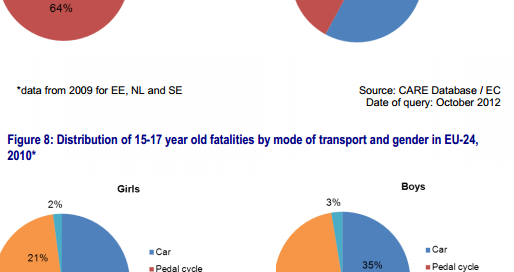
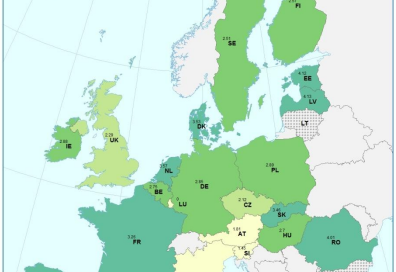
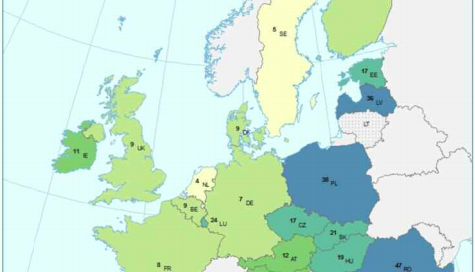
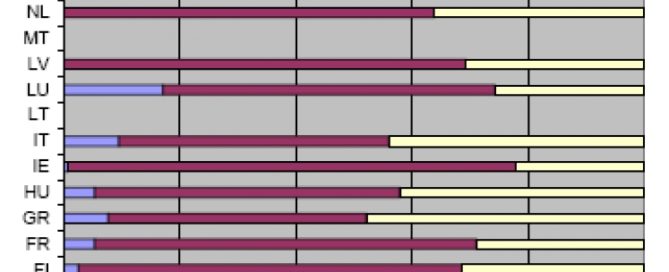
The Road Safety Unit of DG Move of the European Commission is constantly updating its statistics website, with rich and easy to consult information on the latest trends on road safety in the European Union. Visitors of this website can find updated trends of road fatalities, several detailed road safety maps with specialinteractive tools, charts and figures, as well as several comprehensive basic fact sheets with data on key road safety issues. These data are easily available and very useful for all road safety decision makers and other stakeholders in Europe. ![]()