Road Safety Data
Road Safety Data concern the most recent tables and figures on road crashes, risk exposure and performance indicators in Greece, in Europe and worldwide gathered from various Greek and International data sources like the European Commission, ELSTAT, CARE, Eurostat, IRTAD, NTUA, etc.

About the Greek road safety data ![]()
| INTERNATIONAL
i-SafeModels Global Road Safety Platform |
|
| Road Crashes | Behaviour |
| Risk Exposure | Other |
| Performance Indicators | |
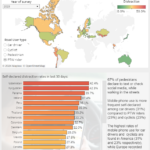
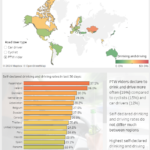
About the International road safety data ![]()


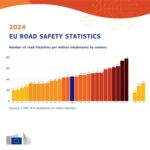
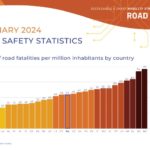
These highly successful initiatives of the Greek Authorities led to a record saving of 148 lives: 517 in 2025 in comparison to 665 in 2024. With these results (49,7 fatalities per million population), Greece is leaving the zone of lowest performance EU countries (63,8 fatalities per million population in 2024), and is approaching the EU average road safety performance (43 fatalities per million population).
We are proud having contributed actively through our systematic advocacy interventions to the Authorities and the media, for prioritizing motorcycle safety and helmet wearing as the catalysers for significant reduction of road casualties in Greece. ![]()
![]()
![]()


Fruitful discussions with NTUA Professor George Yannis, Deputy Mayor for Ecological Transition, Ana Lisa Boni and Deputy Mayor for Sports, Luca Bellinato took recently place, demonstrating the need to intensify efforts for lower speeds and safer roads everywhere and for all.